Wei Kang is an Assistant Professor at the University of California Riverside. Her research interests are methodological - spatial statistics/econometrics, as well as empirical - housing, urban & neighborhood change, inequality, growth, and sustainability. Her current projects focus on housing and open source spatial data science. She is the core developer and maintainer of the widely used open-source spatial analysis python library – PySAL.
PhD in Geography, 2018
Arizona State University
MSc in Cartology and GISystem, 2014
Peking University
BSc in Geographic Information System, 2011
Wuhan University
Participated NSF projects include:
Using the Household Pulse Survey and American Community Survey, this study examines employment insecurity experienced across different racial/ethnic groups of the U.S. labor force under the pandemic disruptions. It highlights significant employment security disparities based on race, ethnicity, and income during the pandemic. However, there are no significant gender and racial disparities within the lowest income group when controlling for other conditions. In contrast, gender and racial disparities in EI are much more pronounced among mid-to-high income groups. Non-White individuals were disproportionately affected by job loss due to health and COVID-related employment issues, unlike Whites who faced unemployment more due to other factors. This pattern was more evident among lower-income groups. The trends shifted in later stages, with high-income Black and Hispanic workers becoming more likely to be unemployed due to non-health and non-employment reasons. Middle-income workers across all races were least likely to stop working for reasons other than COVID-related health or employment issues. In addition, regardless race or ethnicity, women more likely to be unemployed due to health reasons and less so due to employment issues compared to men, and the gender disparities increased with higher household incomes. We propose that the apparent immediate effects of the pandemic are actually indicative of deeper, systemic issues within the U.S. labor market, specifically the occupational segregation tied to race/ethnicity, gender, and class. Recovery efforts must take a holistic approach and integrate economic development policies, workforce development strategies, and social policies targeting poverty alleviation, health disparities, and people of color.
This chapter provides an overview of exploratory approaches to spatial dynamics. The focus is on the application and evidence within social sciences. Spatial dynamics is concerned about the changes in both the spatial and temporal dimensions. Two types of exploratory methods to spatial dynamics are differentiated. The first type extends classic longitudinal methods to interrogate the role of locations in shaping the temporal dynamics, while the second type extends exploratory spatial data analysis methods to investigate its temporal changes. Example methods for each type are illustrated, including spatial explicit Markov methods, a family of spatially explicit rank concordance, and space-time LISA. Though these methods are promising in advancing spatial and spatiotemporal thinking in social sciences, a lack of dynamic cross-fertilization between the field of geographical methodology and social sciences is recognized.
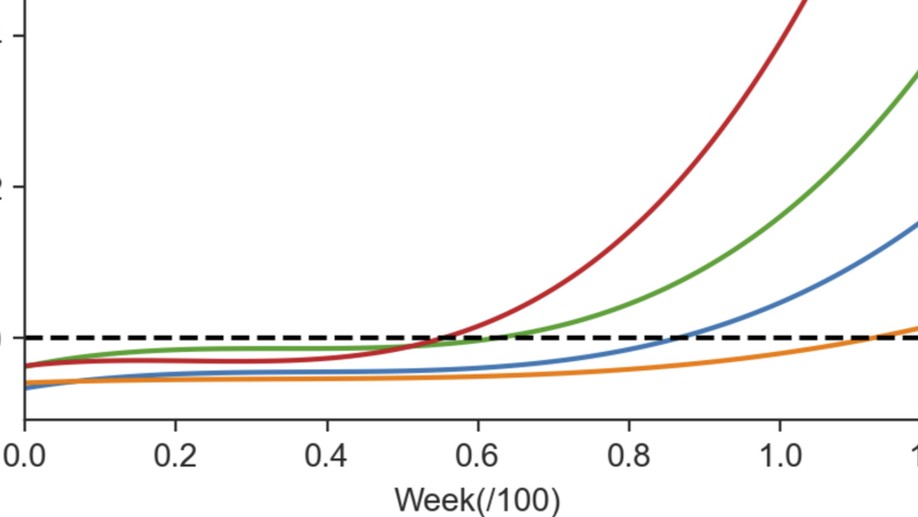
Small businesses have suffered disproportionately from the COVID-19 pandemic. We use near-real-time weekly data from the Small Business Pulse Survey (April 26, 2020 - June 17, 2021) to examine the constantly changing impact of COVID-19 on small businesses across the United States. A set of multilevel models for change are adopted to model the trajectories of the various kinds of impact as perceived by business owners (subjective) and those recorded for business operations (objective), providing insights into regional resilience from a small business perspective. The findings reveal spatially uneven and varied trajectories in both the subjectively and the objectively assessed impact of COVID-19 across the U.S., and the different responses to the pandemic shock can be explained by evolving health situations and public policies, as well as by the economic structure and degree of socioeconomic vulnerability in different areas. This study contributes to scholarship on small businesses and regional resilience, as well as identifying policies and practices that build economic resilience and regional development under conditions of global pandemic disruption.
In this paper we move away from a static view of neighbourhood inequality and investigate the dynamics of neighbourhood economic status, which ties together spatial income inequality at different moments in time. Using census data from three decades (1980–2010) in 294 metropolitan statistical areas, we use a statistical decomposition method to unpack the aggregate spatiotemporal income dynamic into its contributing components: stability, growth and polarisation, providing a new look at the economic fortunes of diverse neighbourhoods. We examine the relative strength of each component in driving the overall pattern, in addition to whether, how, and why these forces wax and wane across space and over time. Our results show that over the long run, growth is a dominant form of change across all metros, but there is a very clear decline in its prominence over time. Further, we find a growing positive relationship between the components of dispersion and growth, in a reversal of prior trends. Looking across metro areas, we find temporal heterogeneity has been driven by different socioeconomic factors over time (such as sectoral growth in certain decades), and that these relationships vary enormously with geography and time. Together these findings suggest a high level of temporal heterogeneity in neighbourhood income dynamics, a phenomenon which remains largely unexplored in the current literature. There is no universal law governing the changing economic status of neighbourhoods in the US over the last 40 years, and our work demonstrates the importance of considering shifting dynamics over multiple spatial and temporal scales.
As spatial statistics are essential to the geographical inquiry, accessible and flexible software offering relevant functionalities is highly desired. Python Spatial Analysis Library (PySAL) represents an endeavor towards this end. It is an open-source python library and ecosystem hosting a wide array of spatial statistical and visualization methods. Since its first public release in 2010, PySAL has been applied to address various research questions, used as teaching materials for pedagogical purposes in regular classes and conference workshops serving a wide audience, and integrated into general GIS software such as ArcGIS and QGIS. This entry first gives an overview of the history and new development with PySAL. This is followed by a discussion of PySAL’s new hierarchical structure, and two different modes of accessing PySAL’s functionalities to perform various spatial statistical tasks, including exploratory spatial data analysis, spatial regression, and geovisualization. Next, a discussion is provided on how to find and utilize useful materials for studying and using spatial statistical functions from PySAL and how to get involved with the PySAL community as a user and prospective developer. The entry ends with a brief discussion of future development with PySAL.
Scale is a fundamental geographic concept, and a substantial literature exists discussing the various roles that scale plays in different geographical contexts. Relatively little work exists, though, that provides a means of measuring the geographic scale over which different processes operate. Here we demonstrate how geographically weighted regression (GWR) can be adapted to provide such measures. GWR explores the potential spatial nonstationarity of relationships and provides a measure of the spatial scale at which processes operate through the determination of an optimal bandwidth. Classical GWR assumes that all of the processes being modeled operate at the same spatial scale, however. The work here relaxes this assumption by allowing different processes to operate at different spatial scales. This is achieved by deriving an optimal bandwidth vector in which each element indicates the spatial scale at which a particular process takes place. This new version of GWR is termed multiscale geographically weighted regression (MGWR), which is similar in intent to Bayesian nonseparable spatially varying coefficients (SVC) models, although potentially providing a more flexible and scalable framework in which to examine multiscale processes. Model calibration and bandwidth vector selection in MGWR are conducted using a back-fitting algorithm. We compare the performance of GWR and MGWR by applying both frameworks to two simulated data sets with known properties and to an empirical data set on Irish famine. Results indicate that MGWR not only is superior in replicating parameter surfaces with different levels of spatial heterogeneity but provides valuable information on the scale at which different processes operate.